


QSPI Protocol Exerciser and Analyzer
QSPI Protocol Analyzer (PGY-QSPI-EX-PD) is the Protocol Analyzer with multiple features to capture and debug communication between host and design under test. PGY-QSPI-EX-PD is the leading instrument that enables the design and test engineers to test the respective QSPI designs for their specifications by configuring the PGY-QSPI-EX-PD as Master/Slave, generating QSPI traffic, and decoding the QSPI protocol decode packets.
PGY-QSPI-EX-PD is the leading instrument that enables the design and test engineers to test the QSPI designs for its specifications by configuring PGY-QSPI-EX-PD as master/slave, generating QSPI traffic with error injection capability and decoding QSPI Protocol packets.
This product is temporarily out of stock. You may opt-in our waiting list and we'll notify you once the product is restocked.
Product Features
- Supports QSPI speeds of up to 80MHz
- Ability to configure it as Master or Slave
- Simultaneously generate QSPI traffic and Protocol decode of the Bus
- QSPI Master and Slaves
- STR and DTR Transfer rates
- Extended, Dual, and Quad QSPI Modes Supported
- Variable QSPI data speeds and duty cycle
- Continuous streaming of protocol data to the host computer to provide a large buffer
- A timing diagram of Protocol decoded bus
- Listing view of Protocol activity
- Error Analysis in Protocol Decode
- Ability to write exerciser script to combine multiple data frame generation at different data speeds
- USB 2.0/3.0 host computer interface
- API support for automation in Python or C++
Multi-Domain View

Multi-domain View provides the complete view of QSPI Protocol activity in a single GUI. Users can easily set up the analyzer to generate QSPI traffic using a GUI or script. Users can capture Protocol activity at specific events and decode the transition between Master and Slave. The decoded results can be viewed in the timing diagram and Protocol listing window with autocorrelation. This comprehensive view of information makes it the industry’s best, offering an easy-to-use solution to debug the QSPI protocol activity.
Exerciser

PGY-QSPI-EX-PD supports QSPI traffic generation using GUI and Script. Users can generate simple traffic generation using the GUI to test the DUT. Script-based GUI provides flexibility to emulate the complete expected traffic in the real-world including error injections. In this sample script user can generate QSPI traffic as below:
Script Line #1: PAGE_PROGRAM
Script Line #2: FAST_READ
Script Line #3: PAGE_PROGRAM
Script Line #4: FAST_READ
Script Line #5: SECTOR_ERASE
Script Line #6: FAST_READ
Timing Diagram and Protocol Listing View
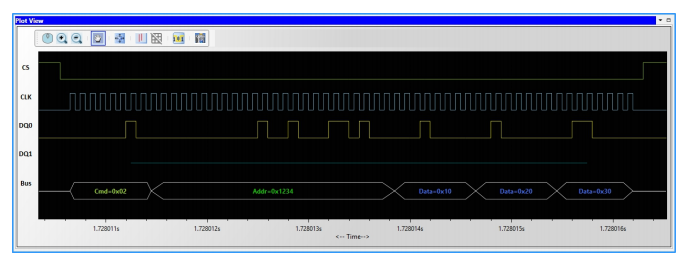
The timing view provides the plot of CS, CLK, DQO, and DQ1 signals with a bus diagram. Overlaying of Protocol bits on the digital timing waveform will help easy debugging of Protocol decoded data. Cursor and Zoom features will make it convenient to analyze Protocol in the timing diagram for any timing errors.

The protocol window provides the decoded packet information in each state and all packet details with error info in the packet. The selected frame in the Protocol listing window will be autocorrelated in the timing view to view the timing information of the packet.
Setup View
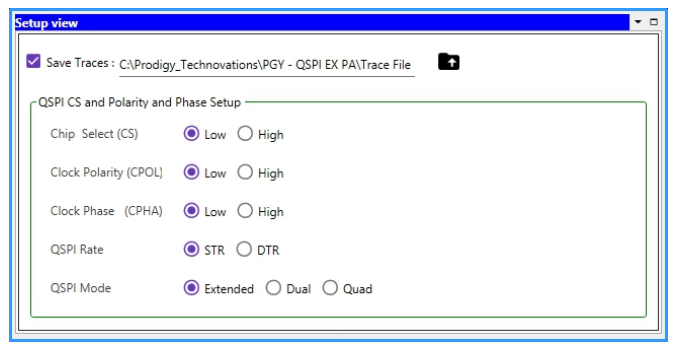
Setup View of PGY-QSPI-EX-PD allows the user to configure the QSPI chip select (CS), Clock Polarity (CPOL), Clock Phase (CHPA), QSPI rate of STR or DTR, and the different modes of QSPI such as Extended, Dual or Quad.
Datasheets